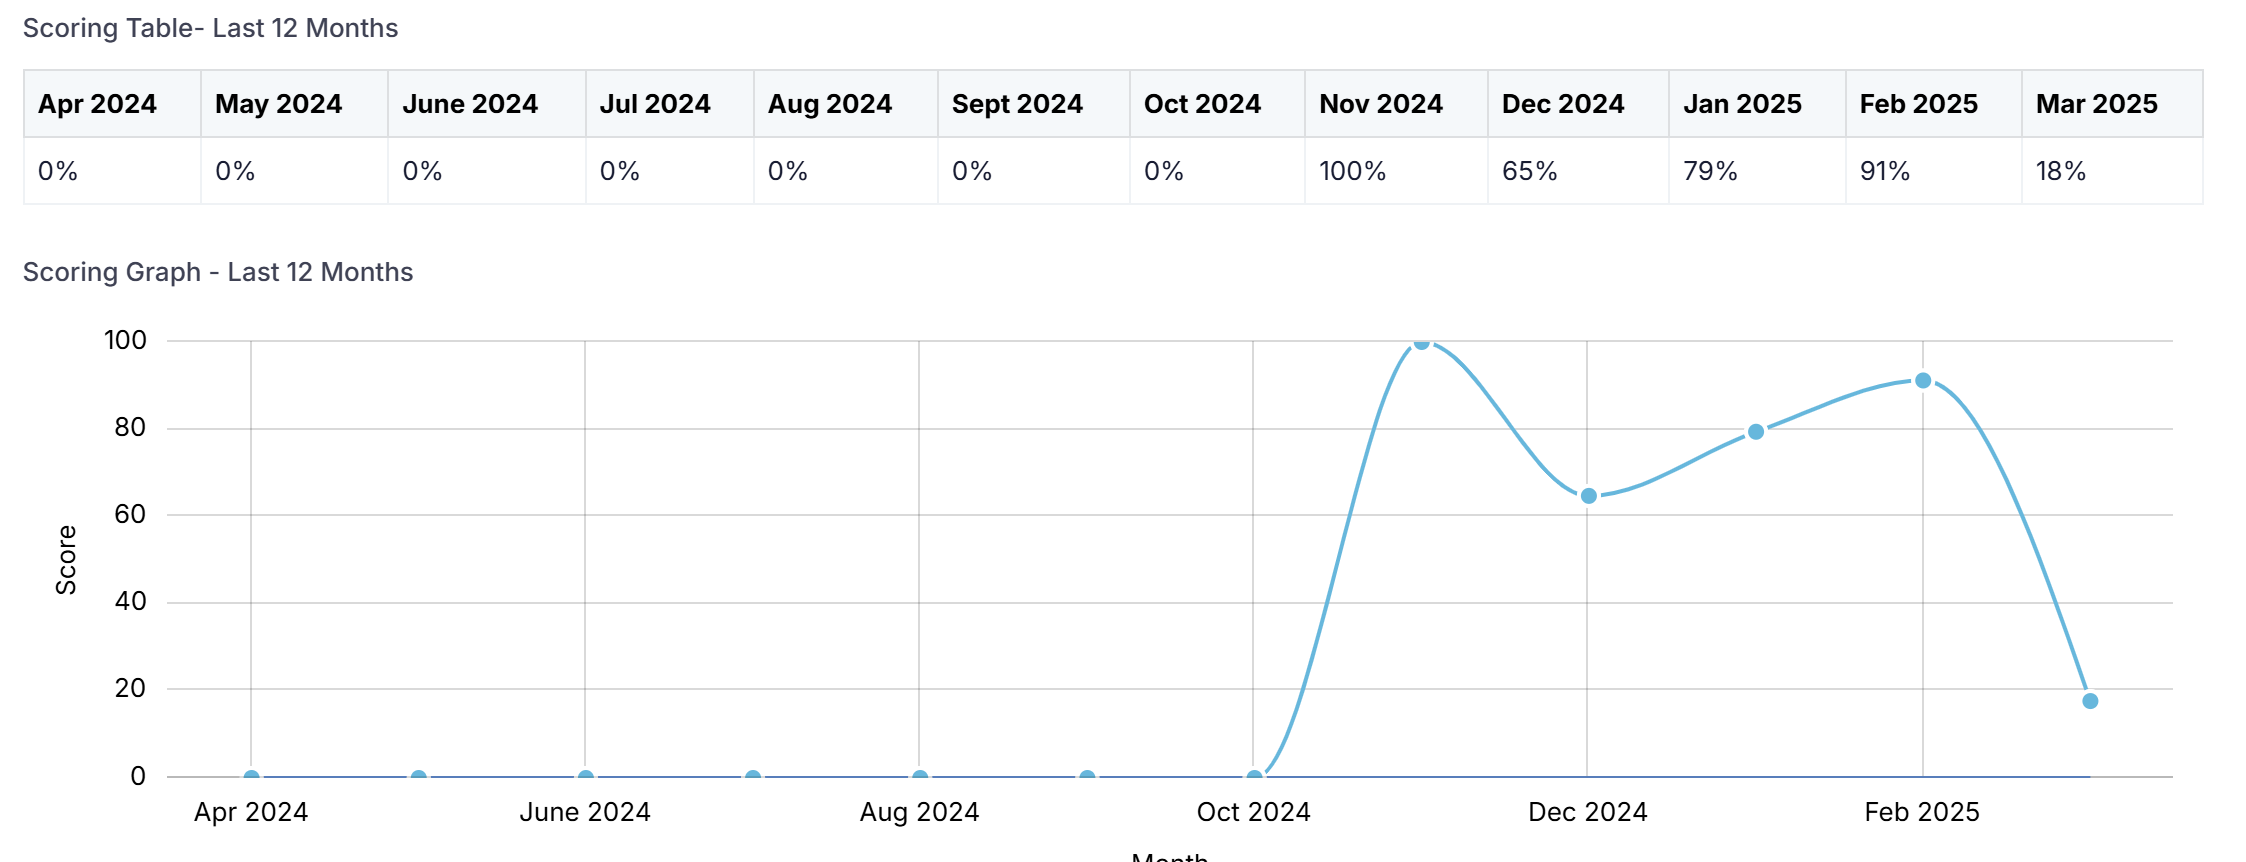
The chart summary component is designed to be used with forms that are entered on a monthly basis.
The component can be displayed as either a table or chart with the intention of taking the form date and a value (score) from the form and keep a running monthly total for up to the last 12 months.
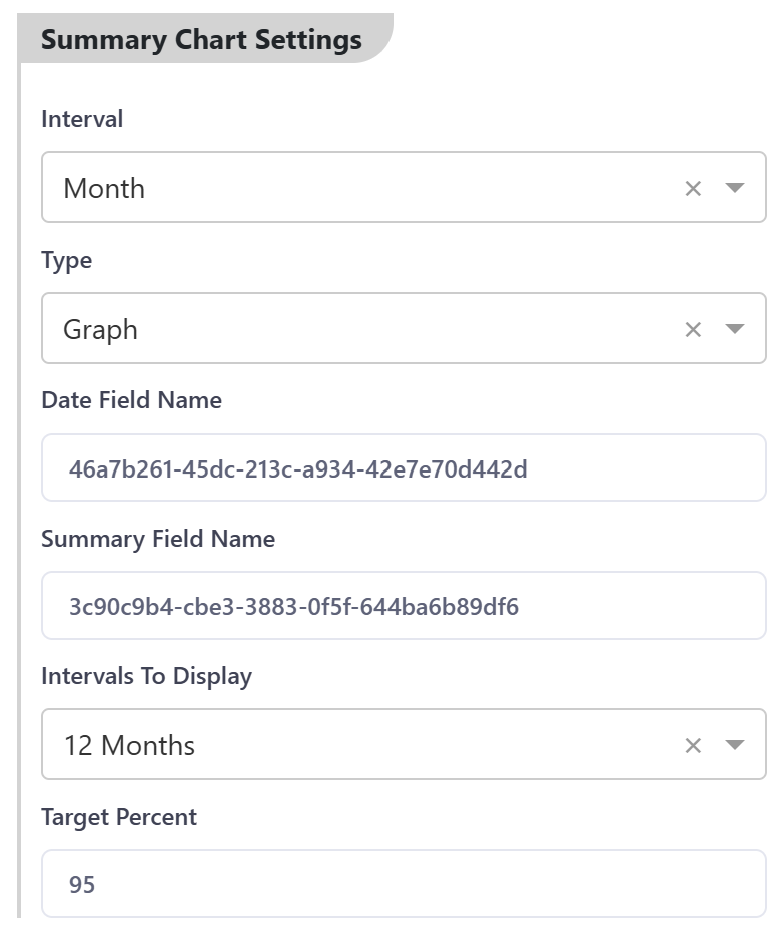
- Interval - Must be Month
- Type - Either Table or Chart
- Date Field Name - Should be a field on form which indicates the month which this form has been entered for.
- Summary Field Name - A numeric field which will contain the value to display in table or to be graphed.
- Intervals to Display - An interval of between 1 and 12 months should be selected.
- Target Percent - If type is 'Chart' then this will draw a line where your target value is.
Monthly forms must be entered in sequence and confirmed prior to the next months form being added. Each month the rolling total will be transferred to the new months form, which will display the last 12 months of data up to the current month.
Note: Forms can be entered and back dated as long as they are entered oldest to newest and confirmed before the new form is added.