To setup a dashboard read this first: Creating and Modifying a Dashboard.
The following components are available to use on a dashboard.
Sensor List Display
The sensor list component will display all sensors (except Thermapen) is a list view.
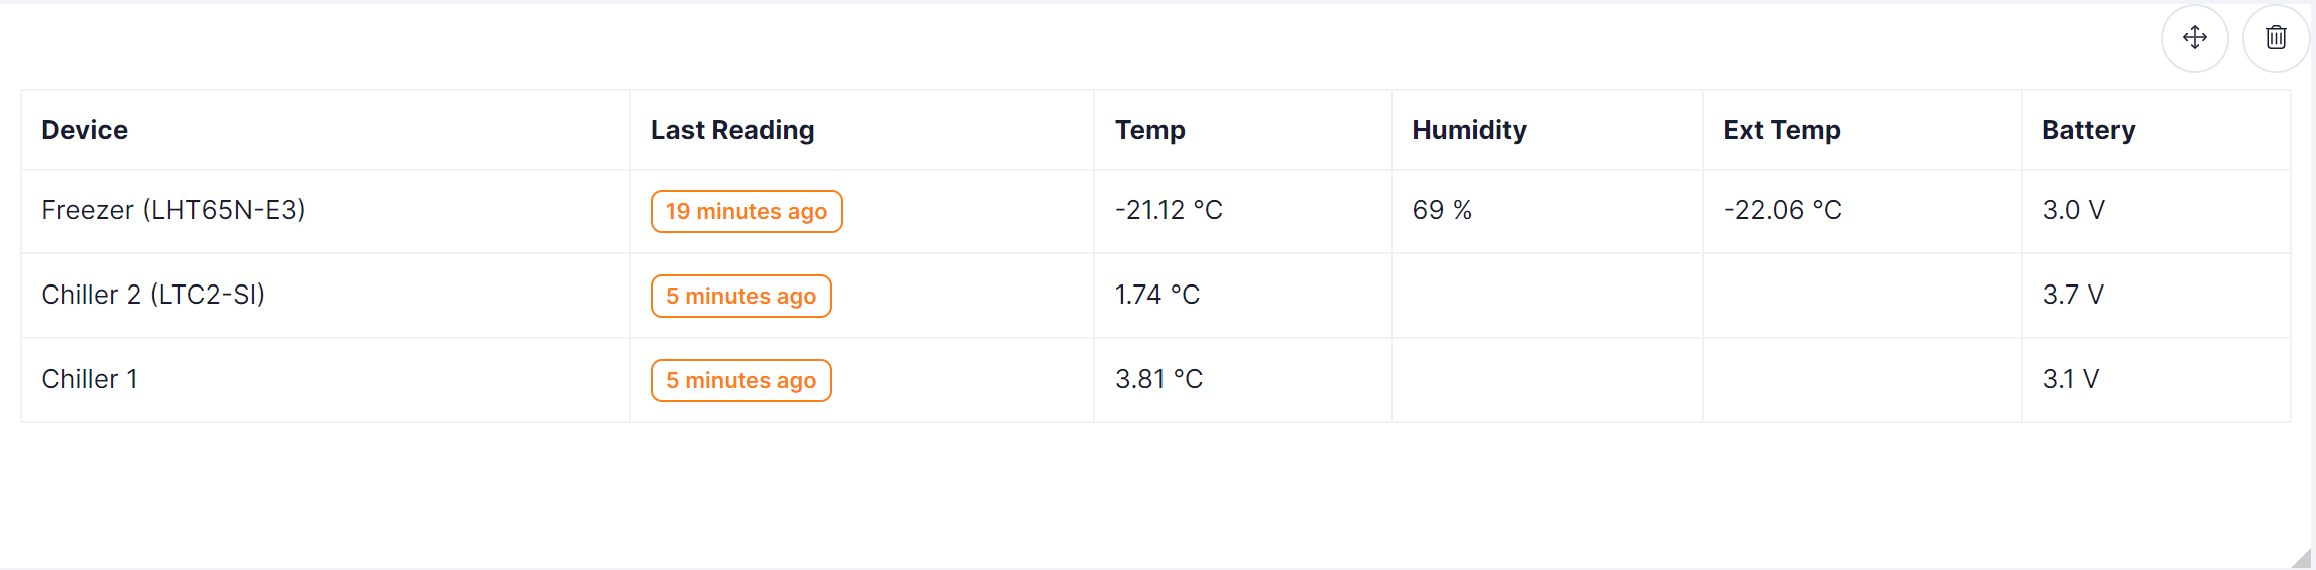
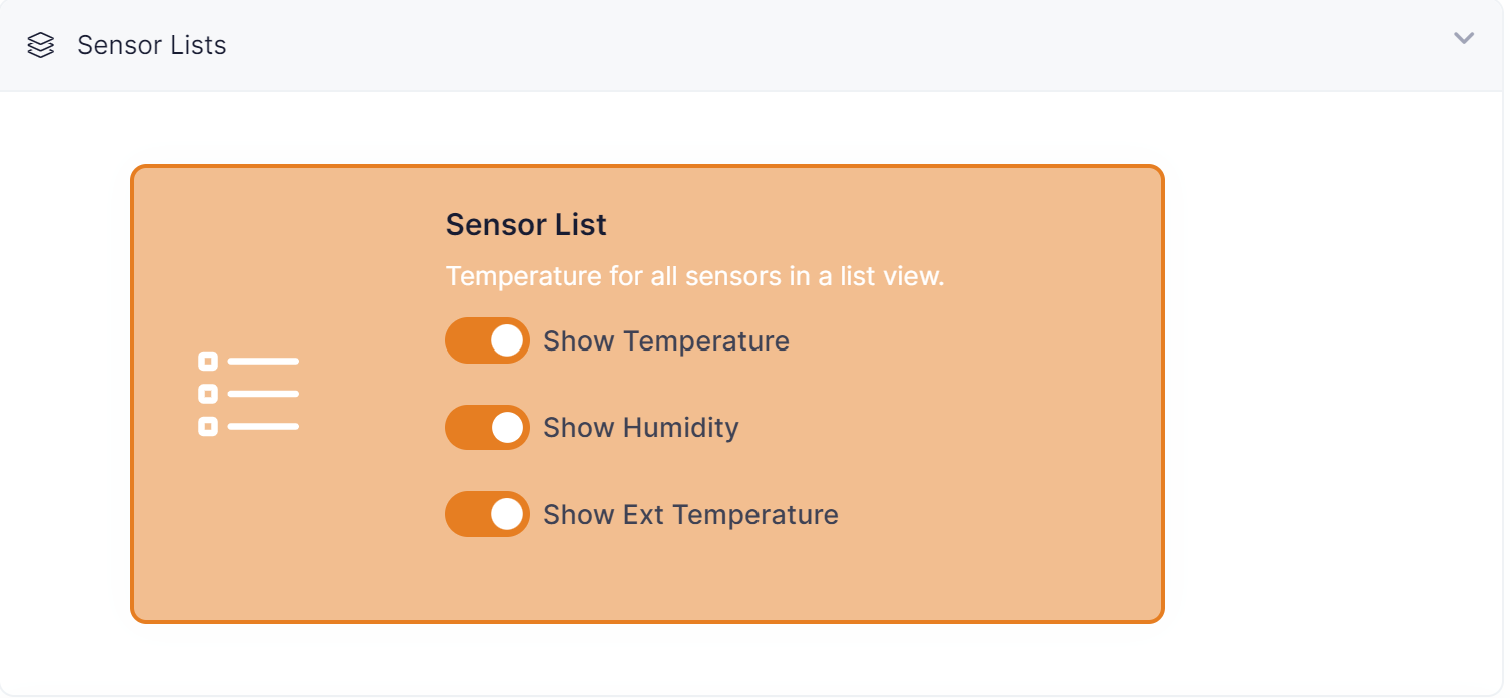
You can select which columns you want to display when choosing the component for display.
Device Gauge Display
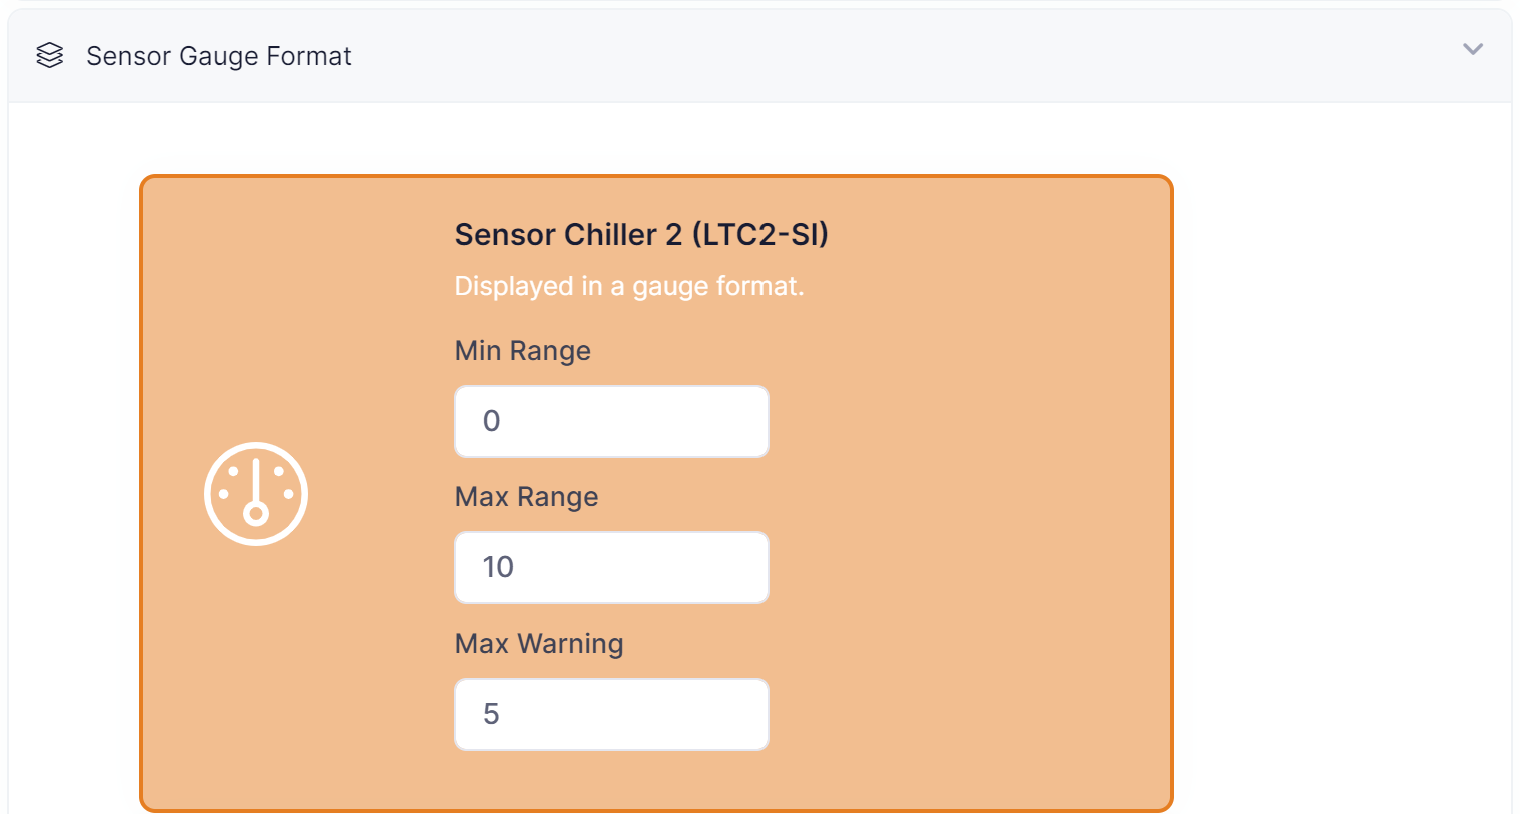
The gauge component will display the temperature in a gauge format.
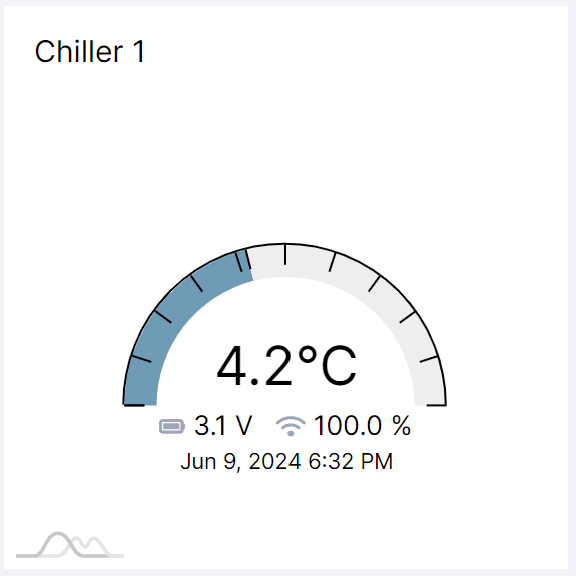
You can set the min range, max range, and max warning when choosing the component for display:
- Min Range: beginning number of range for gauge.
- Max Range: ending number of range for gauge .
- Max Warning: temperature will display red at readings above this number.
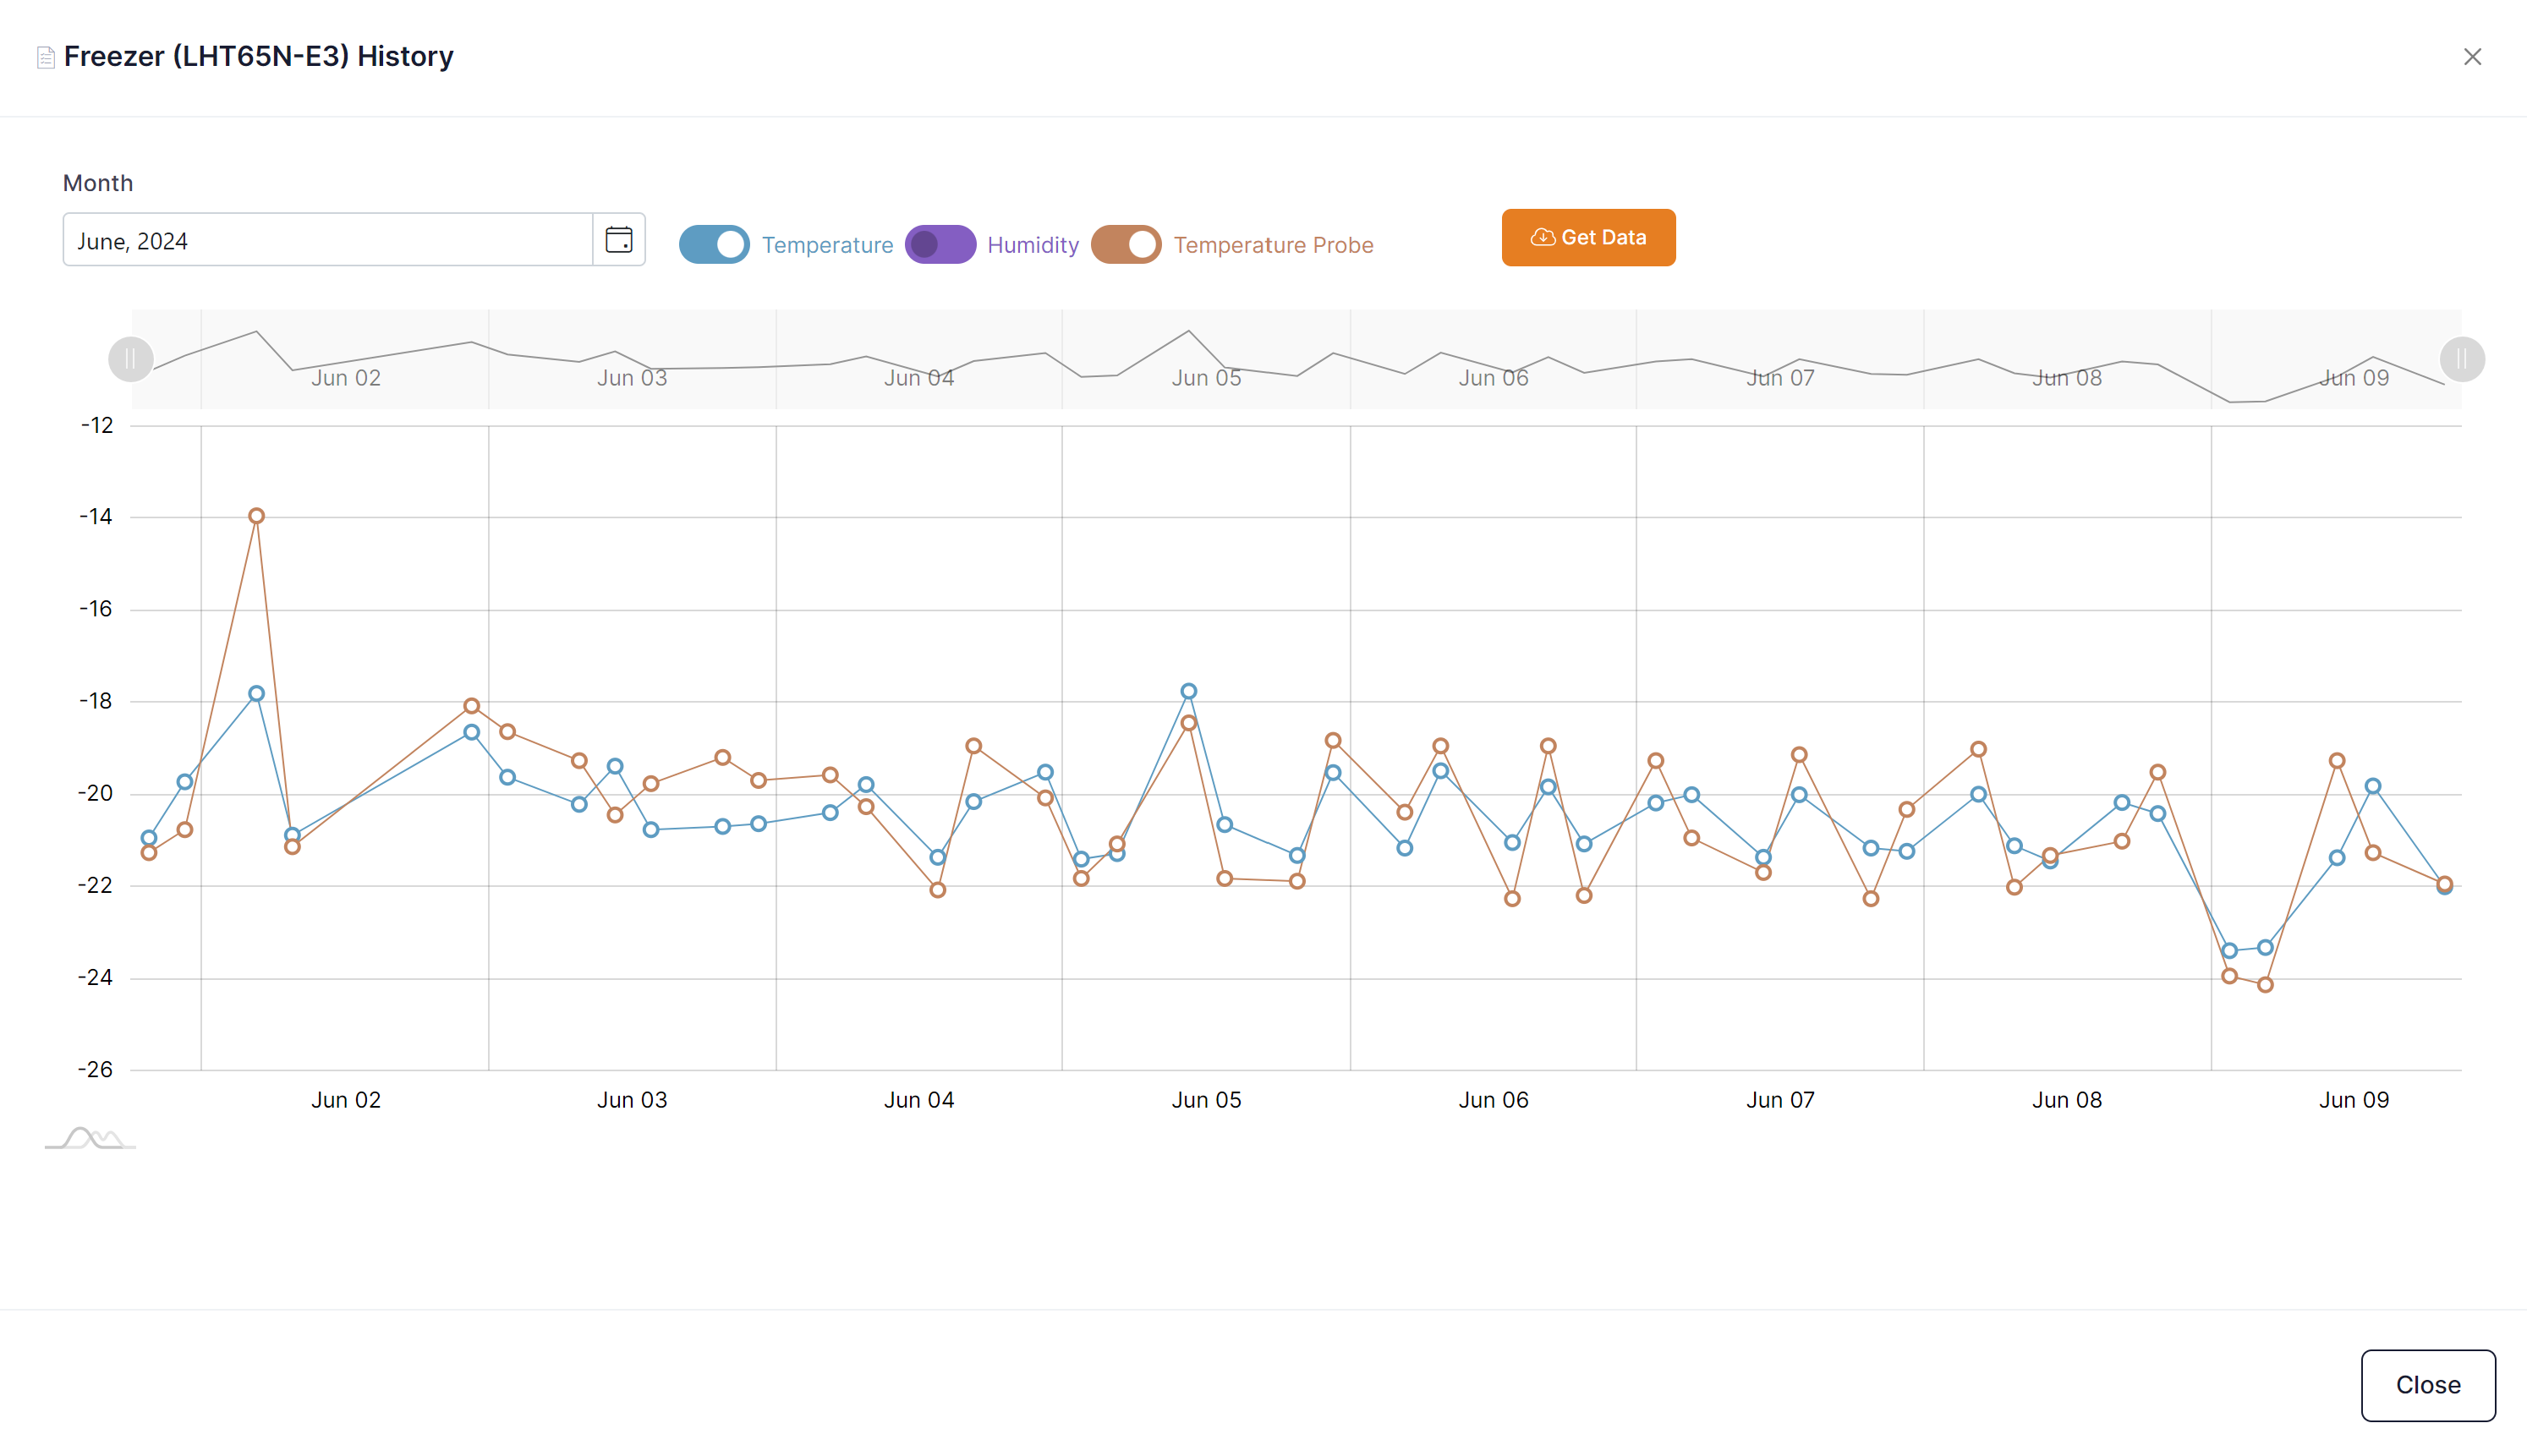
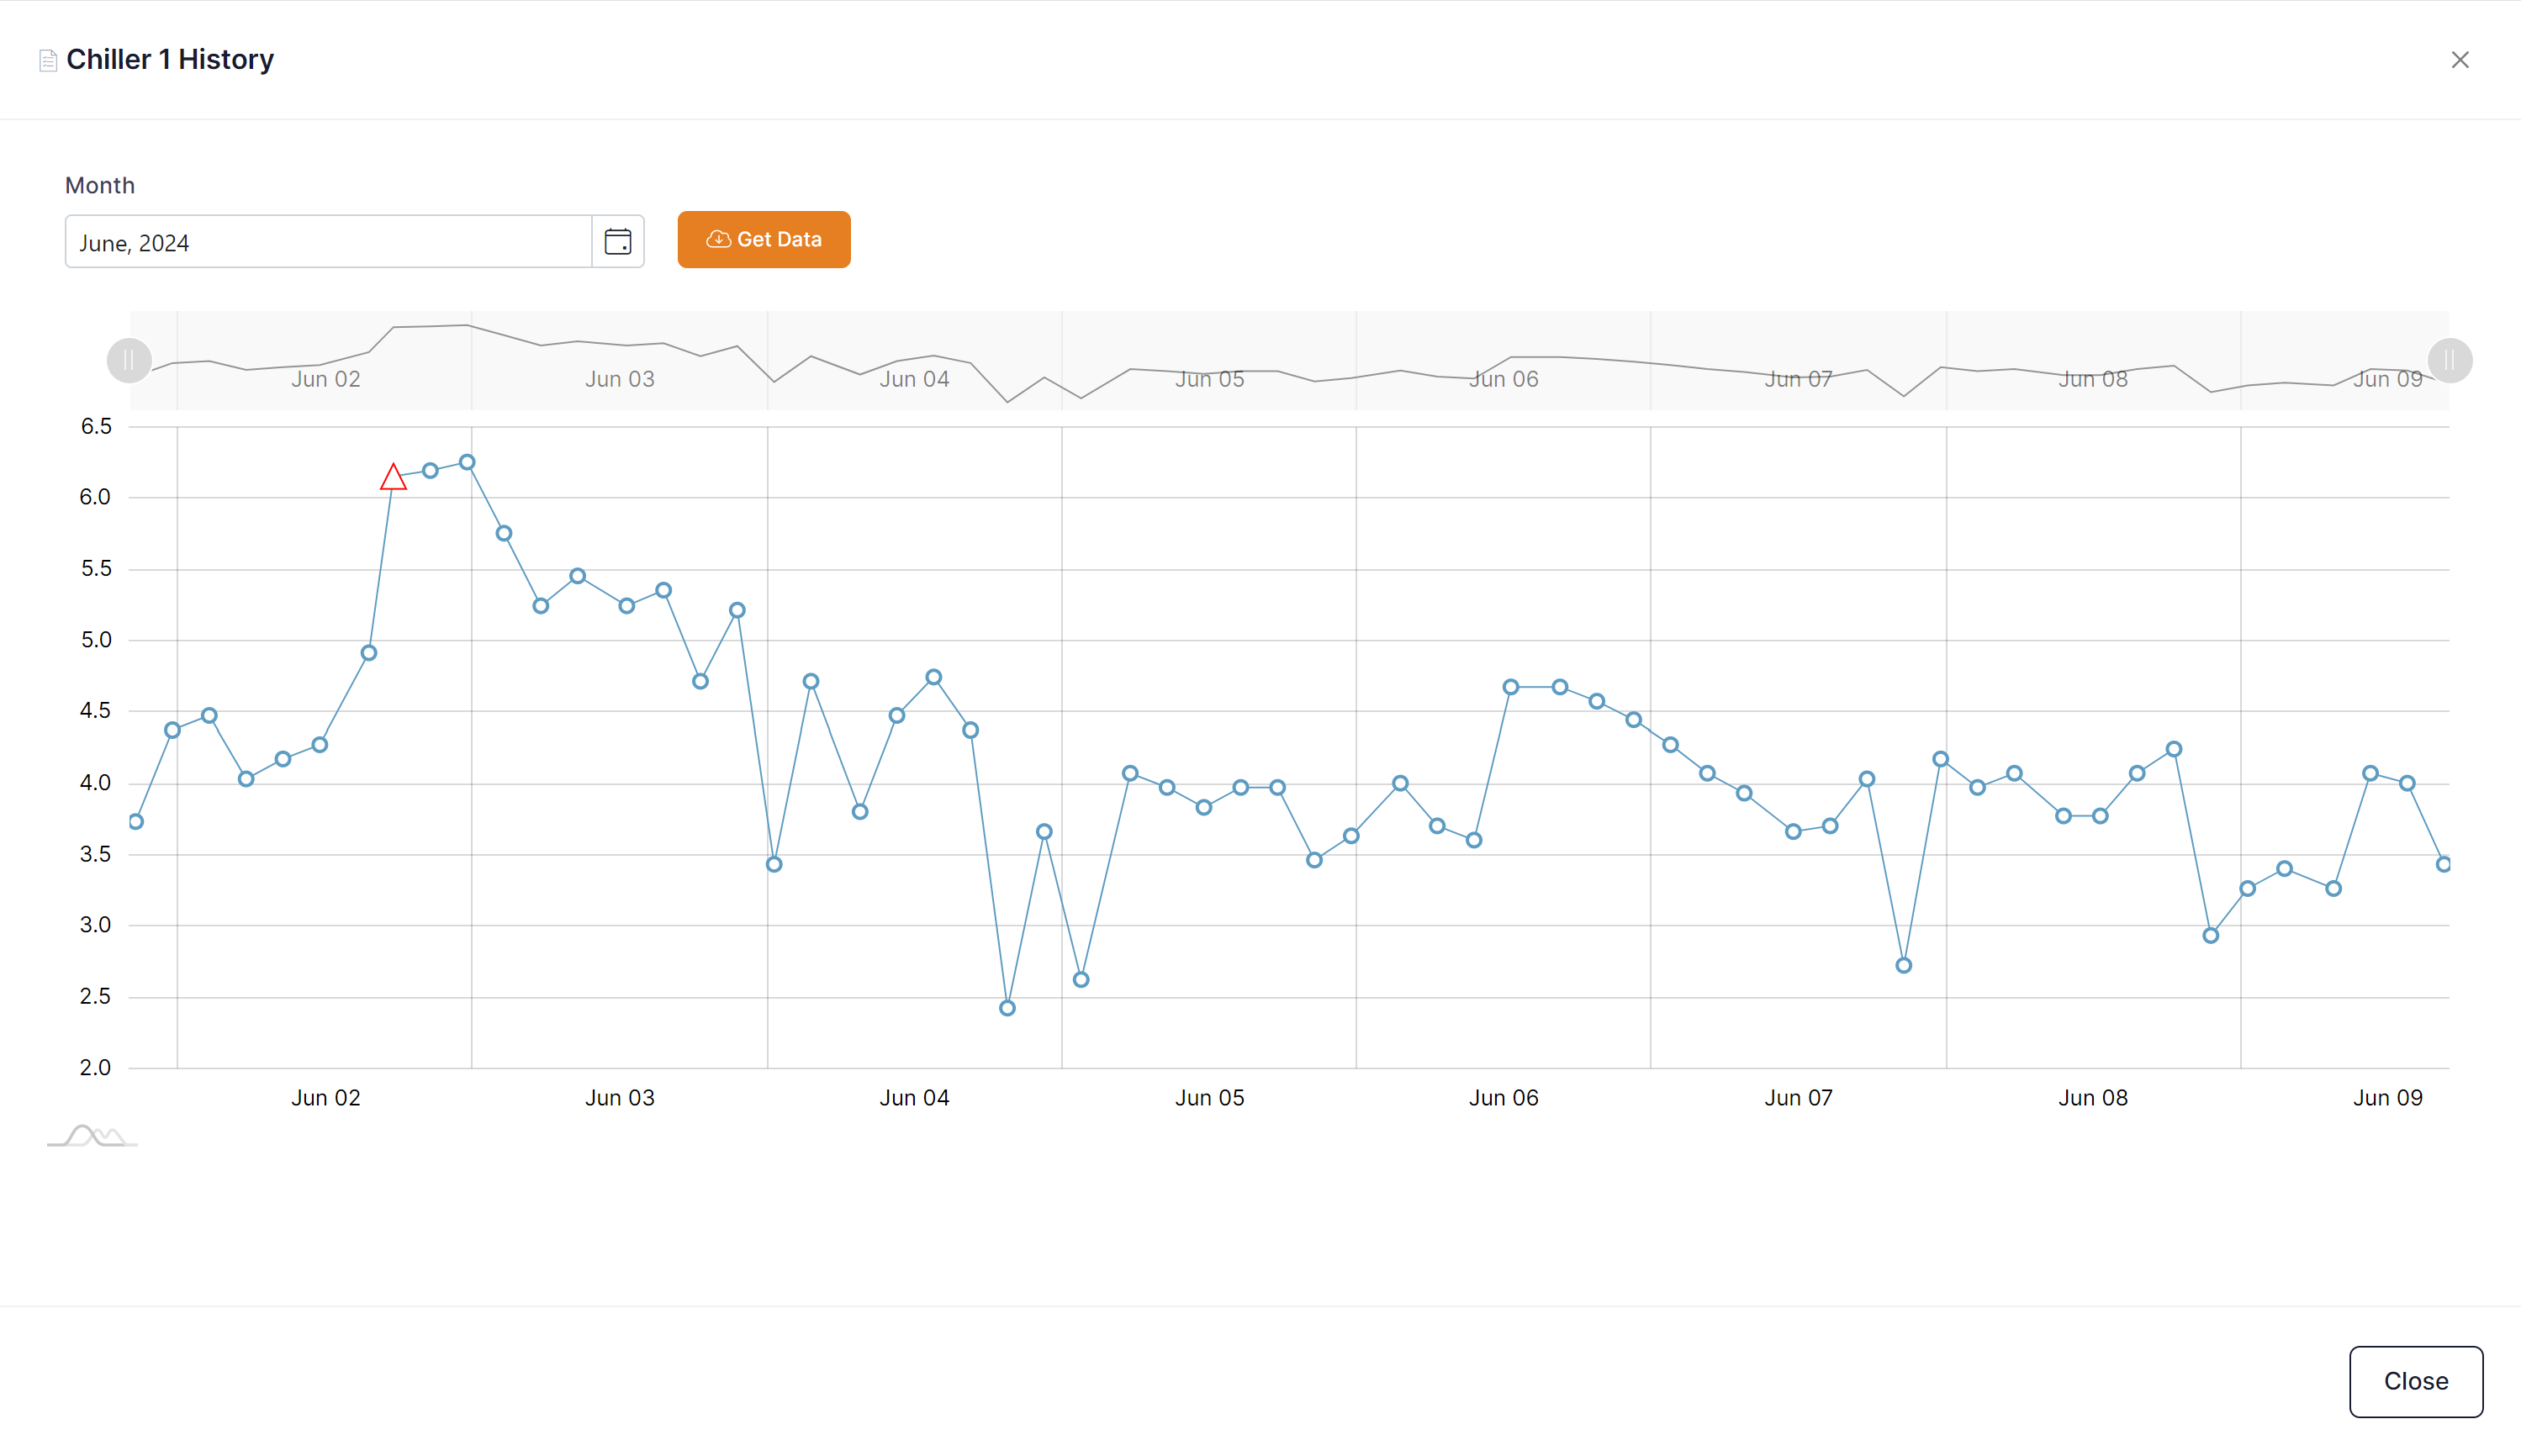
Clicking on the gauge will take you to the history screen. Here you can view historical readings on the sensor by month.
Choose the month, and then click the 'Get Data' button.
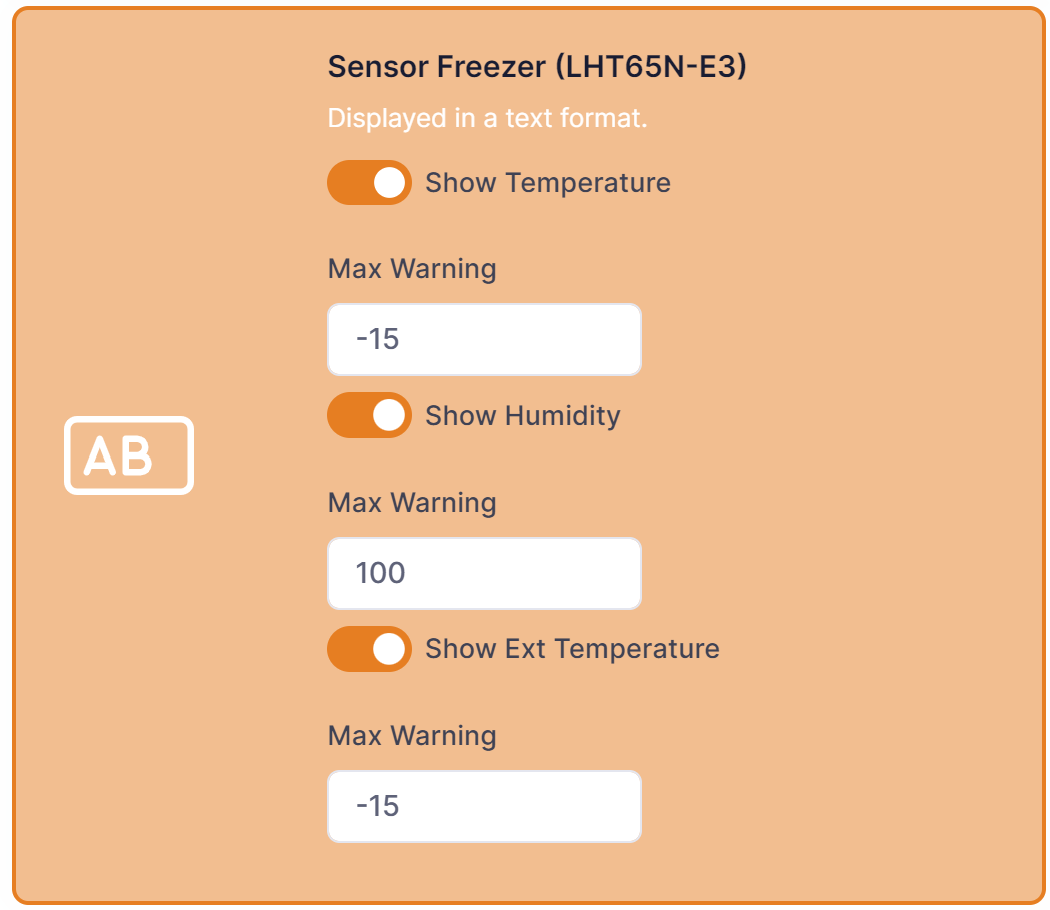
Device Text Display
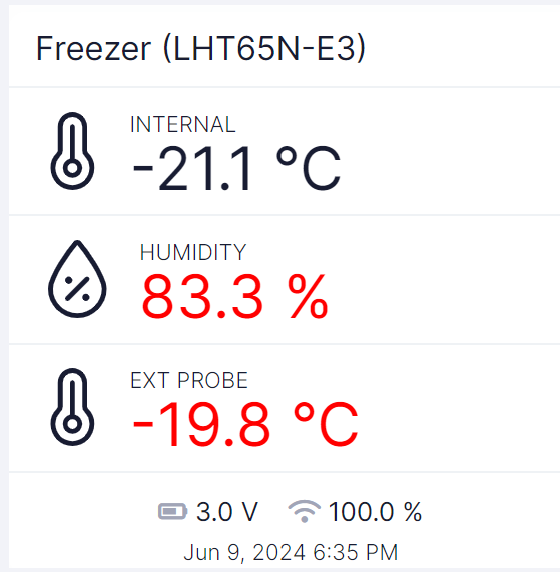
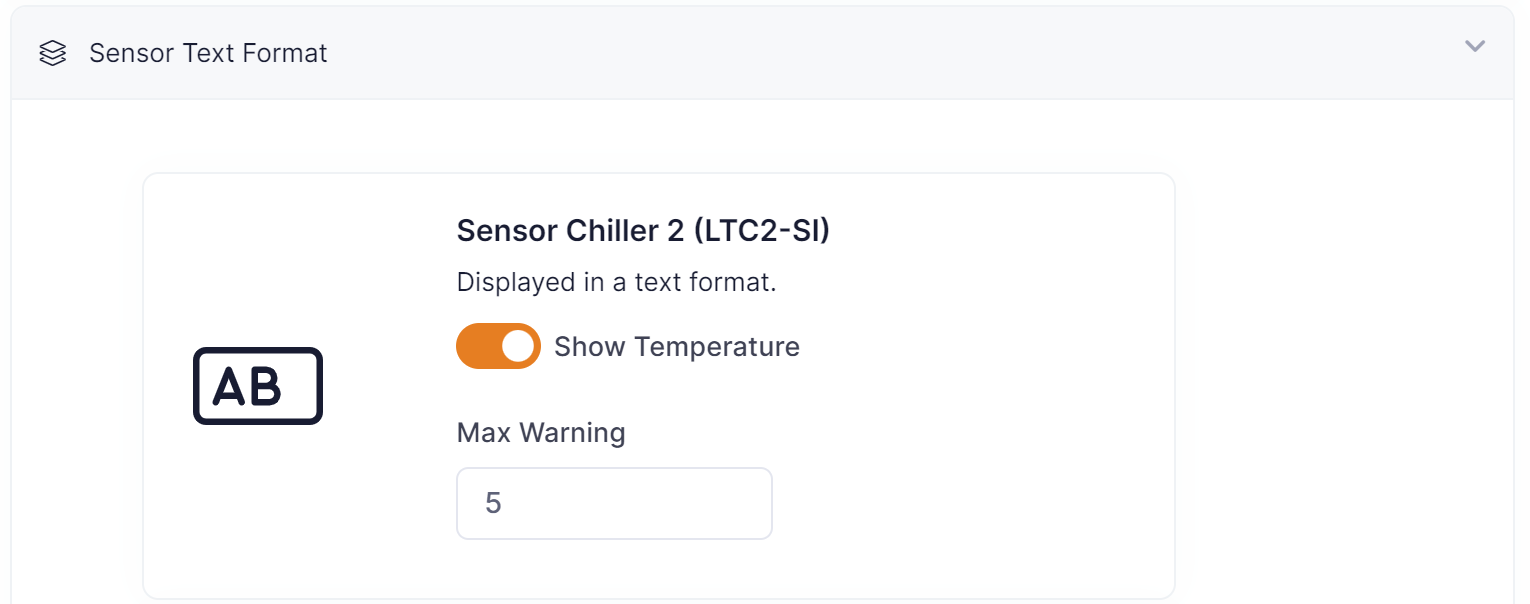
You can set the max warning when choosing the component for display:
- Max Warning: temperature will display red at readings above this number.
If your sensor has multiple readings you can also select which readings you want to display on the component.
Clicking on the component will take you to the history screen. Here you can view historical readings on the sensor by month.
Choose the month, and then click the 'Get Data' button. If your sensor has more than one reading you can display which reading you which to display by selecting them and clicking 'Get Data'.